Consumption of Agrochemicals in India in 2020-21, Maharashtra leads
28 July 2021, New Delhi, IN: The consumption of agrochemicals in India for the year 2020-21 has been 62,192.63 MT (Tech. Grade). The growth over last year i.e 2019-20 has been less than 1%. When compared to the average consumption of last five years (2016-20), the consumption in 2020-21 is about 2% higher.
Maharashtra leads in the consumption of Agrochemicals (13,243 MT, 21.29% share) followed by Uttar Pradesh (11,557 MT, 18.58% share) and Punjab (5,193 MT, 8.35% share). Of all the states across India, Meghalaya and Sikkim have been referred as Organic states as per the data shared on agrochemical consumption.
Also Read: Japan to label seeds, seedling and food as “non-gene-edited”
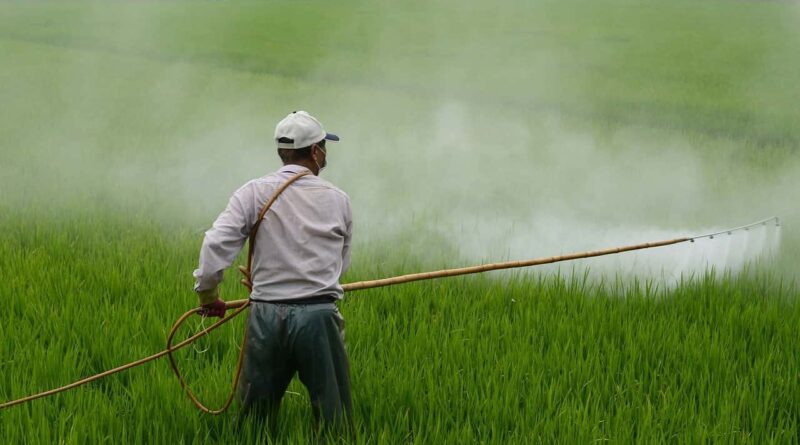
Agrochemicals are also referred to as crop protection chemicals as they help the crop to sustain weeds, pests, diseases and other infestations. One of the key factor for India in achieving self sufficiency in food grains is through the use of crop protection chemicals which has reduced crop loss.
Consumption of Chemical Pesticides (Agrochemicals / Crop protection chemicals) in various States/UTs across India:
| S. No. | States/UTs | 2016-17 | 2017-18 | 2018-19 | 2019-20 | 2020-21 | % Share |
| 1 | Maharashtra | 13496 | 15568 | 11746 | 12783 | 13243 | 21.29% |
| 2 | Uttar Pradesh | 10614 | 10824 | 11049 | 12217 | 11557 | 18.58% |
| 3 | Punjab | 5843 | 5835 | 5543 | 4995 | 5193 | 8.35% |
| 4 | Telangana | 3436 | 4866 | 4894 | 4915 | 4986 | 8.02% |
| 5 | Haryana* | 4050 | 4025 | 4015 | 4200 | 4050 | 6.51% |
| 6 | West Bengal | 2624 | 2982 | 3190 | 3630 | 3630 | 5.84% |
| 7 | Jammu & Kashmir* (UT) | 2188 | 2430 | 2459 | 2198 | 3352 | 5.39% |
| 8 | Rajasthan | 2269 | 2307 | 2290 | 2088 | 2330 | 3.75% |
| 9 | Karnataka | 1288 | 1502 | 1524 | 1568 | 1930 | 3.10% |
| 10 | Tamil Nadu | 2092 | 1929 | 1901 | 2225 | 1834 | 2.95% |
| 11 | Chhattisgarh | 1660 | 1685 | 1770 | 1672 | 1639 | 2.64% |
| 12 | Gujarat | 1713 | 1692 | 1608 | 1784 | 1573 | 2.53% |
| 13 | Andhra Pradesh | 2015 | 1738 | 1689 | 1559 | 1559 | 2.51% |
| 14 | Jharkhand | 541 | 619 | 646 | 681 | 1161 | 1.87% |
| 15 | Orissa | 1050 | 1633 | 1609 | 1115 | 1158 | 1.86% |
| 16 | Bihar | 790 | 840 | 850 | 850 | 995 | 1.60% |
| 17 | Madhya Pradesh | 694 | 502 | 540 | 540 | 691 | 1.11% |
| 18 | Kerala | 895 | 1067 | 995 | 656 | 585 | 0.94% |
| 19 | Assam (NE) | 306 | 241 | 256 | 410 | 420 | 0.67% |
| 20 | Uttarakhand | 198 | 210 | 195 | 224 | 135 | 0.22% |
| 21 | Himachal Pradesh | 341 | 467 | 322 | 881 | 56 | 0.09% |
| 22 | Manipur (NE) | 33 | 27 | NR | 25 | 46 | 0.07% |
| 23 | Nagaland* (NE) | 20 | 20 | 21 | 19 | 36 | 0.06% |
| 24 | Goa* | 22 | 24 | 25 | 30 | 30 | 0.05% |
| 25 | Arunachal Pradesh (NE) | 18 | NR | 5 | 5 | 2 | 0.00% |
| 26 | Andaman & Nicobar (UT) | NR | NR | NR | NR | 1 | 0.00% |
| 27 | Meghalaya (NE) | Organic State | Organic State | Organic State | Organic State | Organic State | 0.00% |
| 28 | Mizoram (NE) | 9 | NR | 26 | 27 | NR | 0.00% |
| 29 | Sikkim (NE) | Organic State | Organic State | Organic State | Organic State | Organic State | 0.00% |
| 30 | Tripura* (NE) | 298 | 330 | 349 | 364 | NR | 0.00% |
| 31 | Chandigarh (UT) | NR | NR | NR | NR | NR | 0.00% |
| 32# | Dadra & Nagar Haveli (UT) | NR | NR | NR | NR | NR | 0.00% |
| 32# | Daman & Diu (UT) | NR | NR | NR | NR | NR | 0.00% |
| 33 | Delhi (UT) | 88 | NR | 110 | NR | NR | 0.00% |
| 34 | Ladakh (UT) | NR | NR | NR | NR | NR | 0.00% |
| 35 | Lakshadweep (UT) | NR | NR | NR | NR | NR | 0.00% |
| 36 | Pondicherry* (UT) | 43 | 43 | 42 | 40 | NR | 0.00% |
| Grand Total | 58,634.43 | 63,405.78 | 59,669.93 | 61,701.90 | 62,192.63 | 100% |
Source: States/UTs Zonal Conferences on Inputs (Plant Protection) for Rabi & Kharif Seasons. NR: Not Reported. (Unit: Quantity in MT Tech. Grade)
* Figures of 2019-20 for this State have been taken from inputs provided by the States/UTs during Zonal Conference (PP) for Rabi,2020-21 Season.
# w.e.f. 26.01.20 the two UTs have been merged into a single UT namely ”Dadra & Nagar Haveli and Daman & Diu”.


 formed in India up till 2020")