20 February2023, US: Getting commodity markets right is difficult under any circumstances. However, getting them right without really good supply/demand forecasts is nearly impossible. While demand can have its variations, the supply side traditionally holds the biggest swings in an agricultural commodities. The vagaries of weather can cause production to swing from boom to bust quickly. This is why we ask, “How accurate are your yield forecasts?”
Production simply comes from two factors: 1) planted area and 2) yield per area of land. Ten months a year we undertake a massive survey process where we ask producers and agribusiness about their expectations on the supply side of US crop production (planted area and yield).
Up until now, we have always thought we are pretty good at it. Now we have the data to prove we are the best in the business.
For many years, the new service Reuters has released a poll of many market participants’ expectations on production and yields prior to the USDA WASDE report. Our team thought it would be worthwhile to see how our forecasts stacked up against others in the industry when it comes to forecasting yields during the most important part of the US growing season. We liked what we saw.
Corn and Soybeans Since 2013, there are 17 different commodity analysts and forecasting services that have submitted US corn and soybean yield forecasts on a regular basis (at least seven of ten years). We objectively measured the accuracy of those forecasts during the most meaningful USDA reports of the year—August, September, and October.
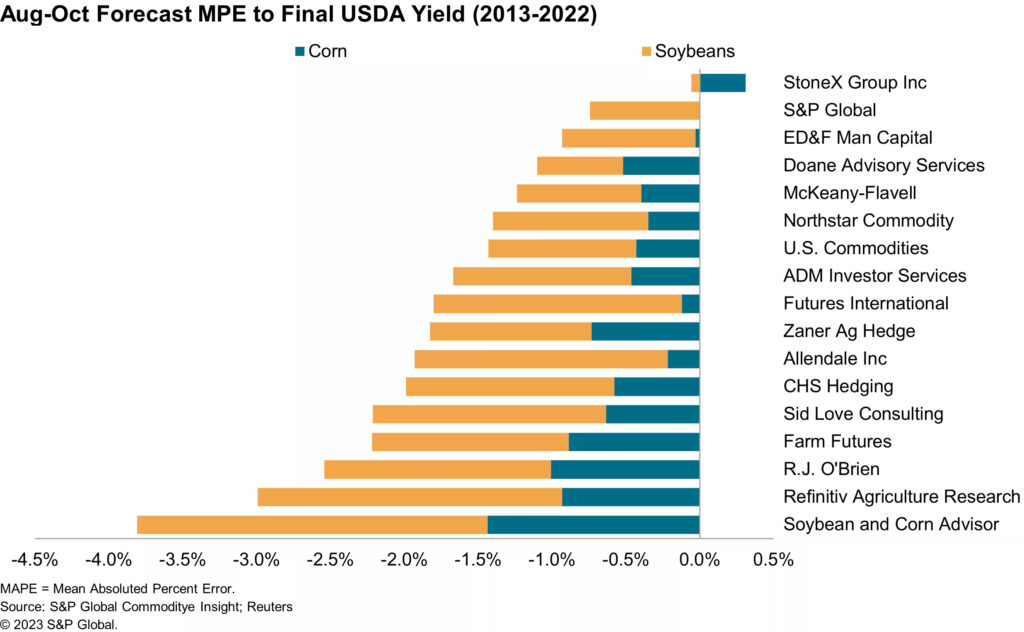
To do this we calculated the mean absolute percentage error (MAPE) versus the end-of-year actual yields from the USDA for each analyst. MAPE is the gold standard for measuring accuracy, as it calculates how consistently close one is to the “truth data”, in this case, the final USDA yield. One should use absolute error, not allowing the positives and negatives to cancel each other out. Two forecasts could be off 10% high and 10% low. Using average simple error, they would look very precise, zero error. However, using MAPE it would show that it was 10% off on average, not so good.
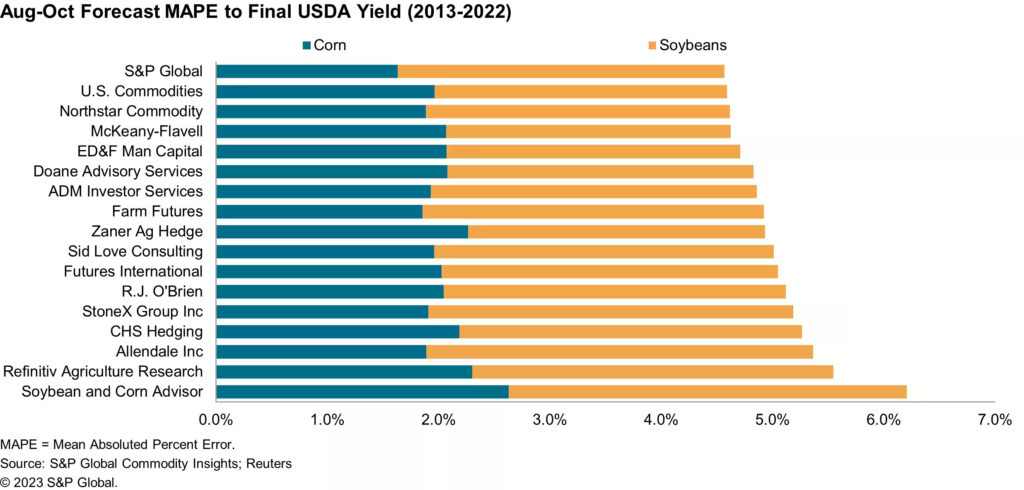
Below are the results for all entities that provided data to the USDA for seven or more years since 2013.
Results for all entities that provided data to the USDA for seven or more years since 2013
S&P Global is the most accurate in forecasting corn and soybean yields as measured by combined MAPE over the most recent 10-year period. Relying on our forecasts gives our clients a significant edge in defining the supply side of the market. This is a big leg up in solving the ever-changing puzzle that is agricultural commodity markets.